

Legal Disclaimer: Past performance does not guarantee future results, which may vary. The economic and market forecasts presented herein are for informational purposes as of the date of this presentation. There can be no assurance that the forecasts will be achieved. Copyright 2026 Alpha Rho Technologies LLC. All rights reserved.
Bottom line
FX intervention slows the yen's depreciation; it does not reverse it.
Fundamentals dictate direction, and they remain intact.
A weaker yen does the work the BOJ cannot safely do itself: it imports inflation and lifts nominal GDP growth, building the case for eventual sustainable monetary policy normalization, which is ultimately what ends the JPY carry trade.
That process requires letting the depreciation run. I think the intervention zone could be lifted from 160 to 170 and subsequently to 180.
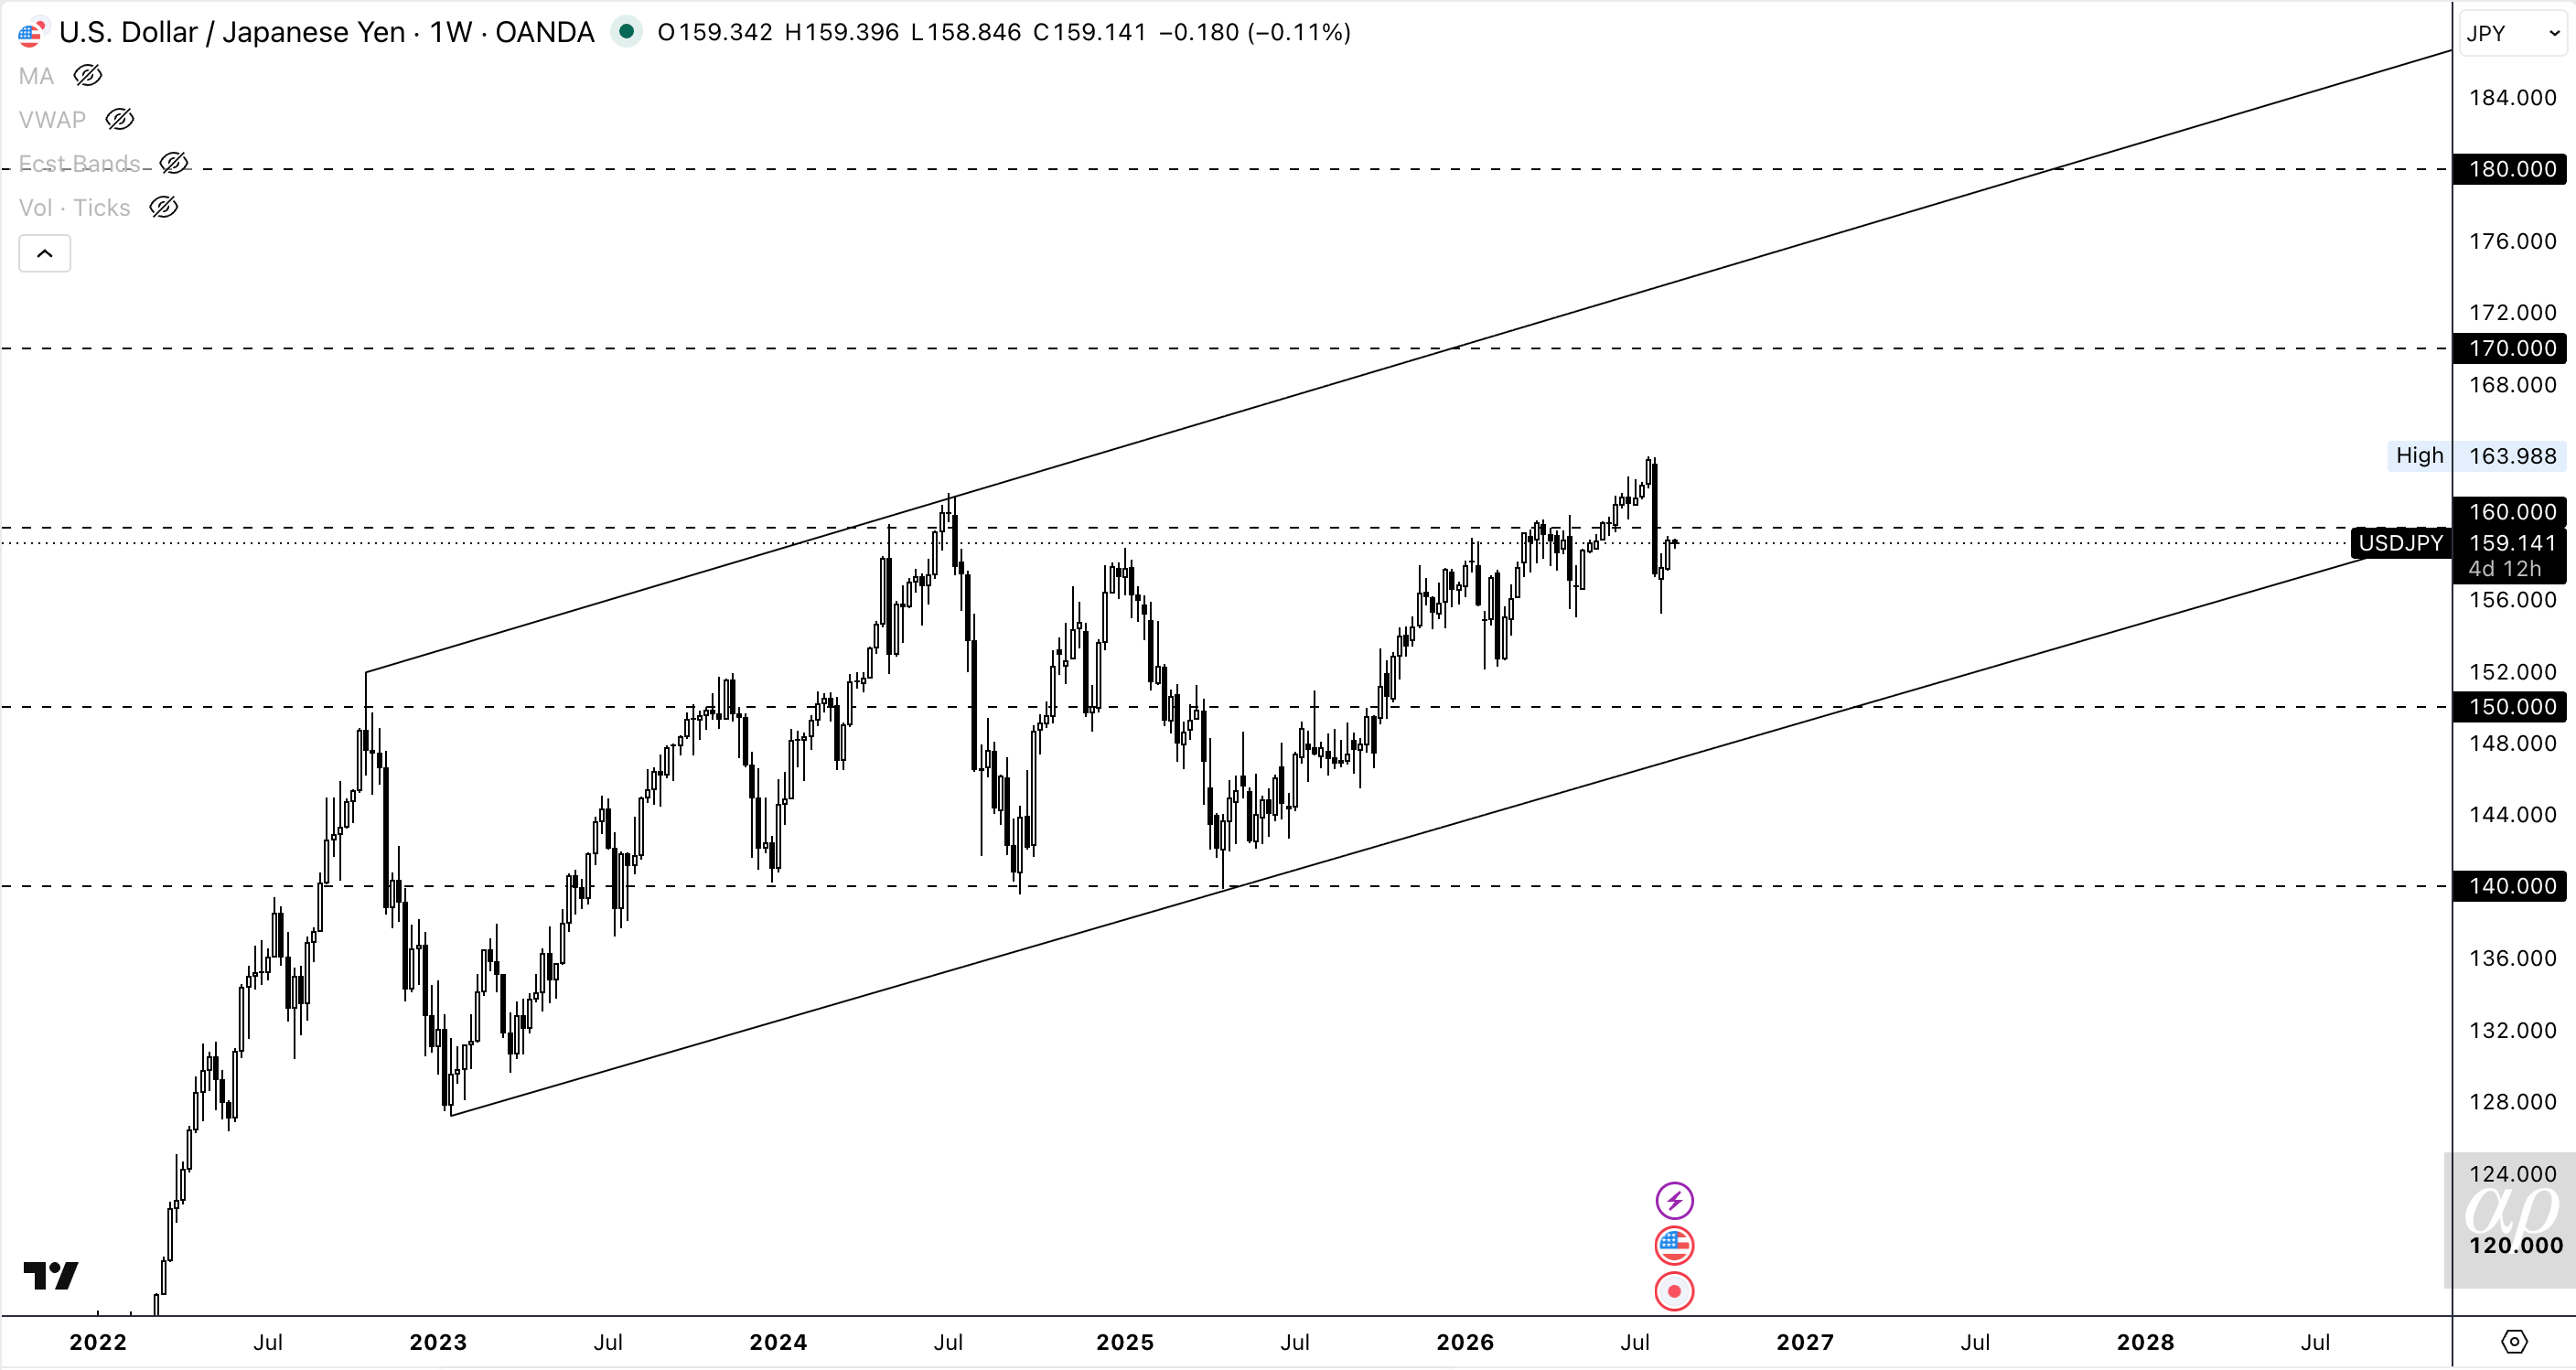
Currently, the USD/JPY is trading inside the intervention zone 160 level, where risk/reward is worst. I expect position unwinding and further intervention to push the pair toward 150. There, with a stop at 140, the risk reward is 1:1 plus carry to retest 160, 2:1 to 170, 3:1 to 180.
A retest of 140 on short covering alone is unlikely. As in July 2024, the move would need a fundamental trigger to sustain it, either lower-than-expected US inflation or a weaker-than-expected labor market.
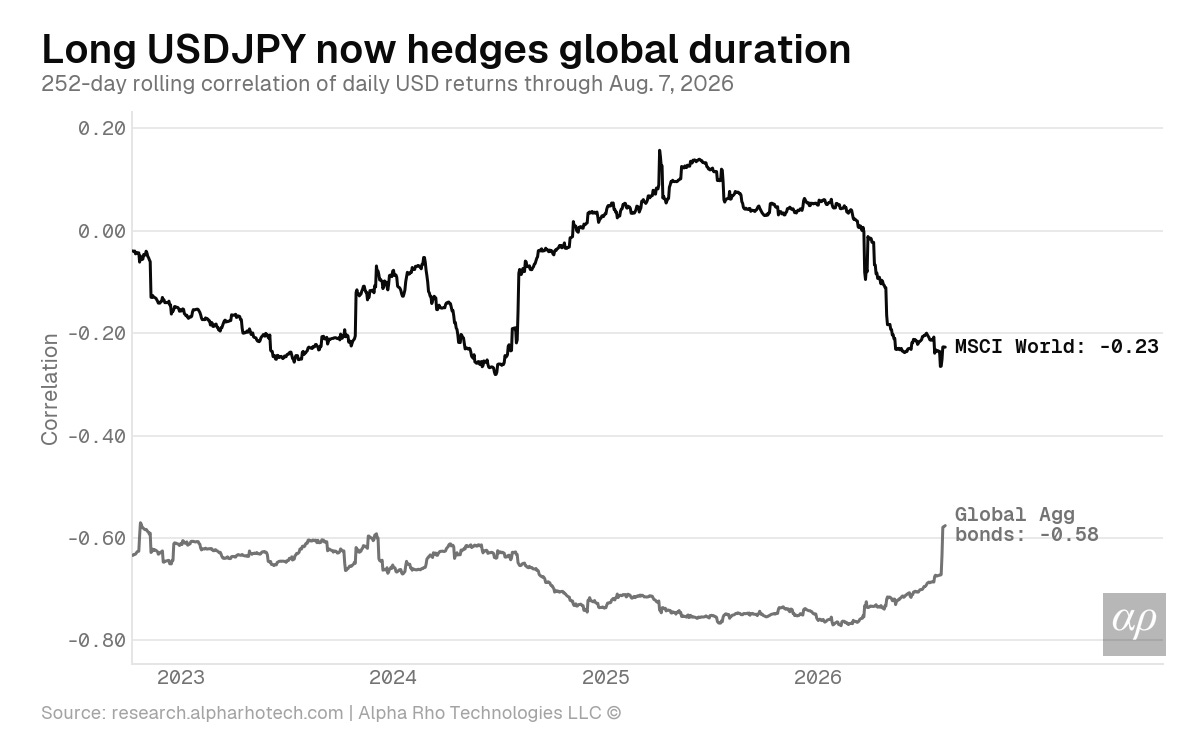
In addition, under the current macro regime, long USD/JPY is a portfolio diversifier; it has a negative correlation with both bonds and equities.
However, it is important to keep in mind that in the event of a US economic slowdown, or aggresive BOJ we could expect the trade to fall alongside equities, and its correlation to rise potentially amplifying portfolio tail risk.
Why the carry trade persists
The yen is at a 40-year low against the dollar. The main driver is the rate differential: borrow yen at 1%, lend dollars to the Fed at 3.75%, earn roughly 2.75% annually before spot. Spot has been additive since 2022, which is what turned a modest carry into a crowded trade.
The BOJ could close the gap by hiking, but that would risk slowing down an economy that has been fighting deflation for many years.
The other leg is equally stuck: US growth is running above trend with above-average inflation and below-average real rates, capping how far the Fed can cut.
Unless the regime changes, neither side of the differential seems to move.
What intervention can and cannot do
Selling Treasuries to buy yen does not change the arithmetic of borrowing at 1% to lend at 3.75%. It changes the risk attached to that arithmetic. The MOF wants the market to know that 2.75% a year is not worth liquidation risk, and with roughly $1 trillion in Treasuries, they can push the price far enough to prove it.
That makes intervention a positioning tool, not a policy tool, and gives two inputs to assess:
Fundamental trigger: Is something independently compressing expected carry? US disinflation, a weaker US labor market, actual BOJ tightening.
Positioning: Are shorts crowded enough that forced covering becomes self-reinforcing?
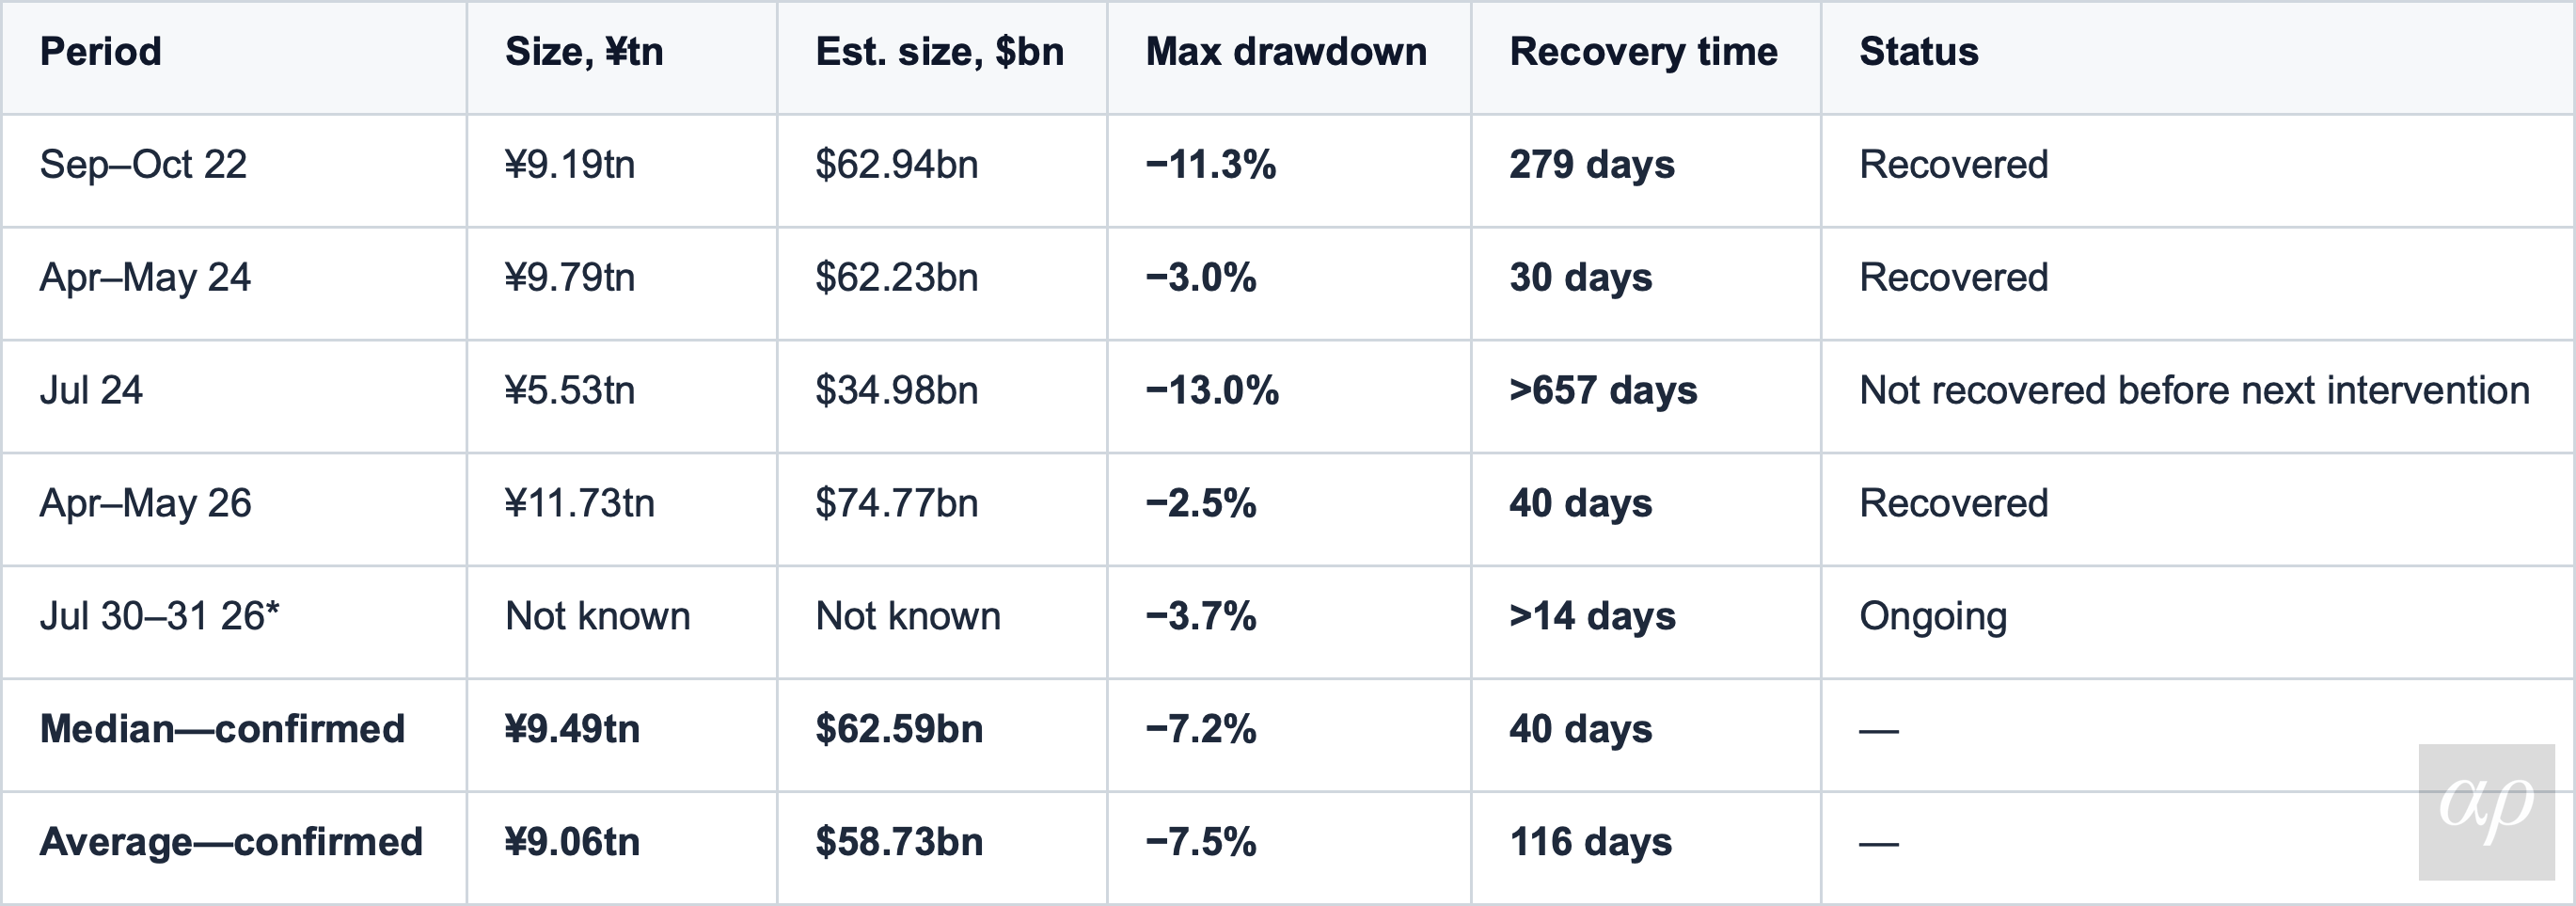
Prior episodes suggest these are not symmetric. A fundamental catalyst is necessary; positioning amplifies.
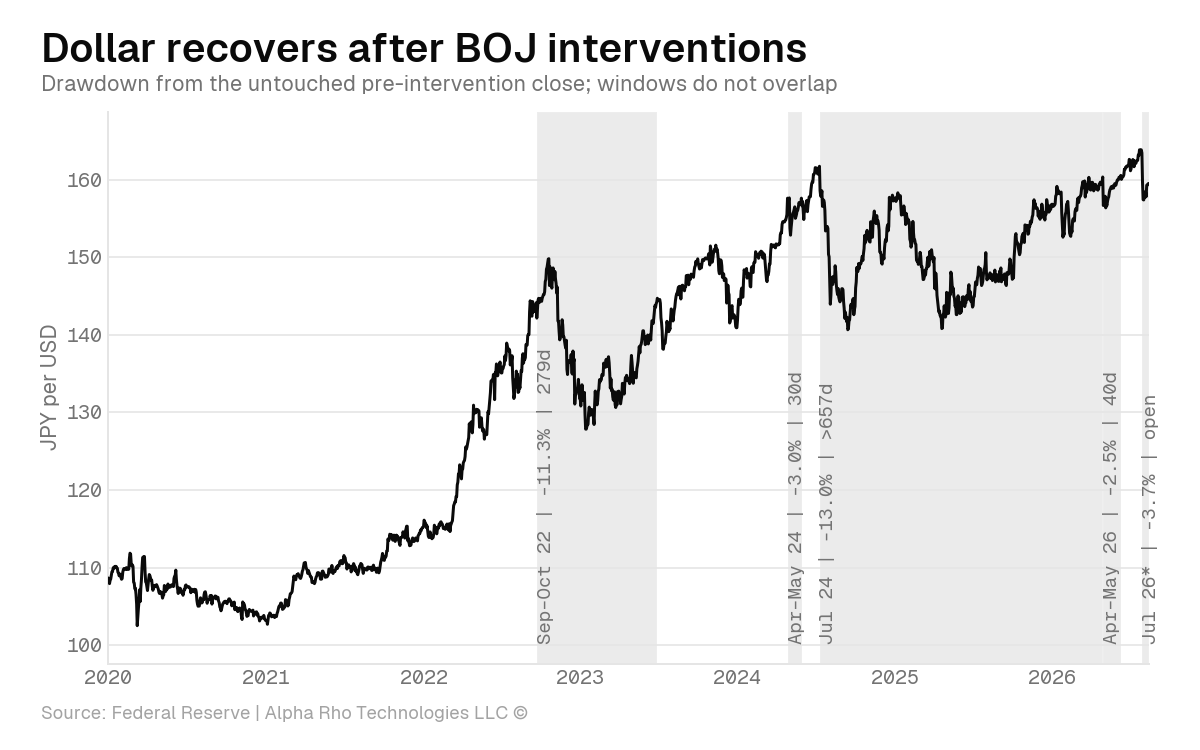
Sep-Oct 2022 intervention delivered -11.3% without crowded positioning: it was a rates repricing, not a squeeze. Intervention marked the turn; US disinflation and the December YCC widening supplied the persistence.
During Apr–May 2024 shorts were about as crowded as they had been all year, but with interest differentials above 500bp traders doubled down, absorbing BOJ dollar sales, recovering the pre-intervention level in 30 days.
In July 2024 we had both inputs at once. Extreme positioning and BOJ tightening combined with weaker-than-expected US labor data. Those forces compressed expected carry and forced covering produced a feedback loop causing a -13.0% drawdown, sending the VIX to 50+ levels, and a -10% drop on the S&P 500.
Apr–May 2026 is the size test. A record ¥11.73 trillion operation bought only a 2.5% drawdown, fully retraced within 40 days. Elevated energy prices were working against it, weakening Japan's terms of trade and adding structural dollar demand that offset the intervention flow.
This goes to show that intervention alone cannot reverse the trade. A fundamental catalyst is needed for traders to consider cutting their exposure.
Where we are now
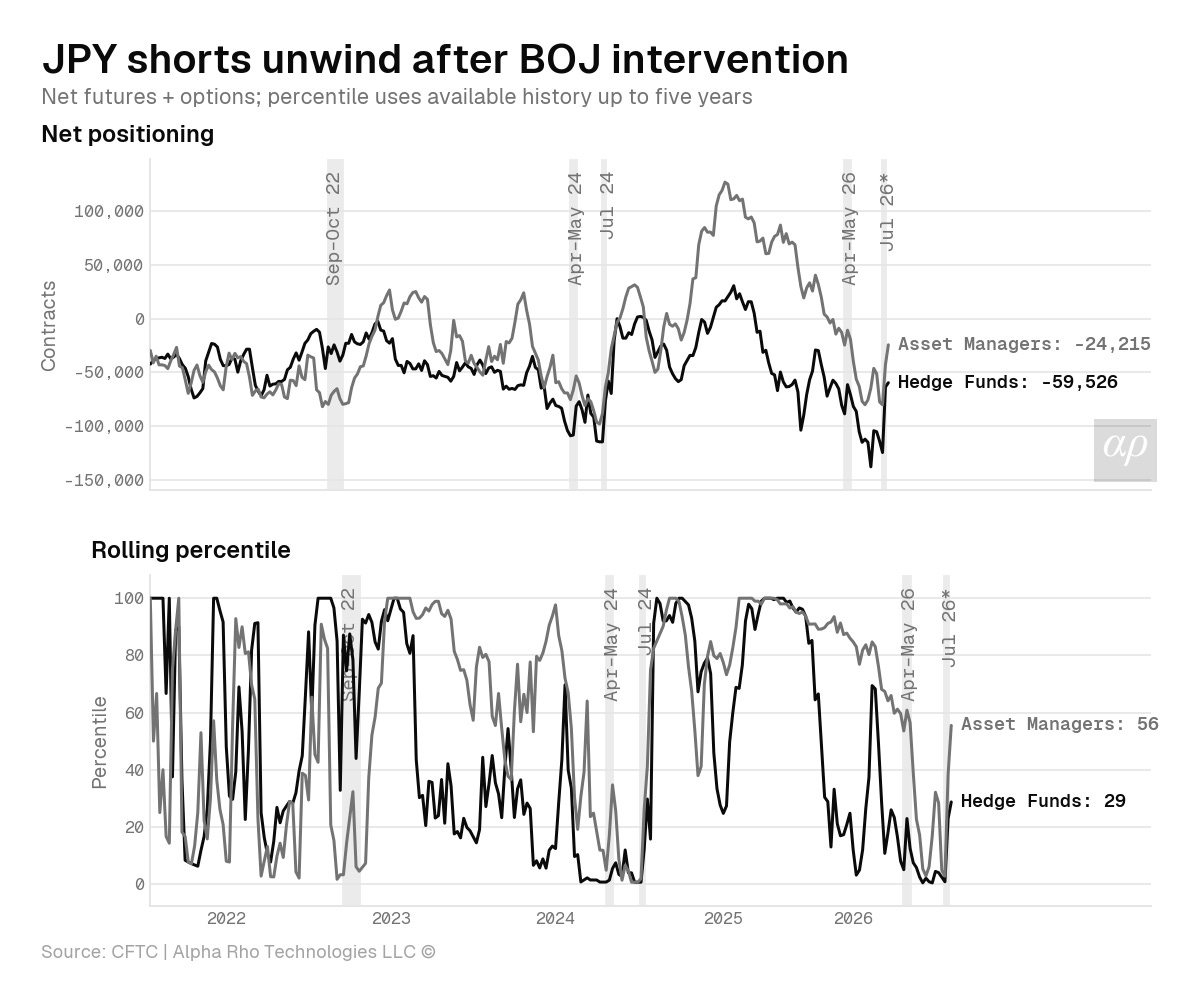
Positioning: cleaner. CFTC data show the latest intervention forced hedge funds and asset managers to cover part of their shorts from record short positioning. Historically, that sets the path an attractive entry point.
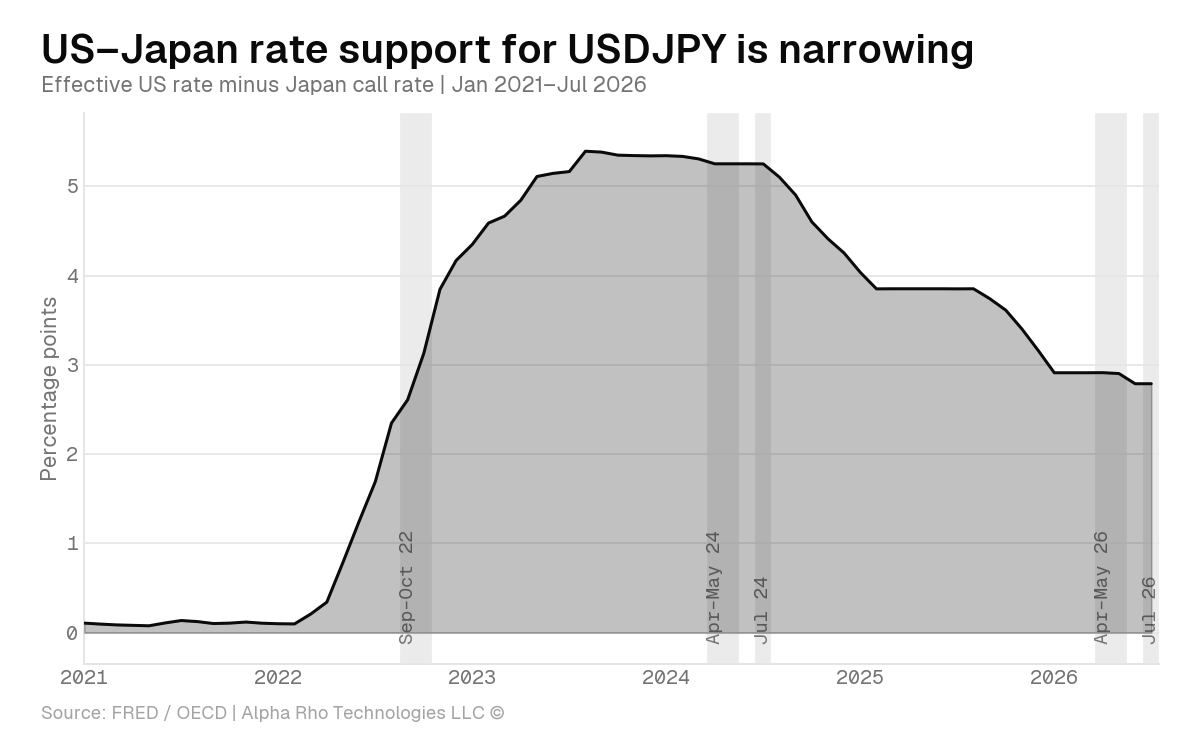
Policy gap: 275–300 bp, wide and stable. Far below 2024‘s 500 bp, nowhere near convergence.
The trade
The current spot price offers a low risk reward, as it sits exactly at the intervention zone. I expect the yen to appreciate the next couple of weeks to retest the 150 level.
Target entry 150. Stop 140. Objectives 160 / 170 / 180.
The stop is not arbitrary. 140 is the July 2024 short-covering low and the level a genuine fundamental trigger would most plausibly reach. At this level a fundamental reassessment of the trade would be needed.
The trade would be invalidated if:
US disinflation surprise: The Fed cuts and compresses the gap directly. Did the work in 2022 and July 2024.
US labor market cracking: Same repricing, plus an equity drawdown alongside it. The correlation-flip scenario.
BOJ normalization: Less likely near-term, but it attacks the other leg. YCC adjustments are the tell, as in December 2022.
Conclusion
The trade attractiveness is proportional to the expected rate differential between Japan and the US. Neither leg is moving. The yen could rally short-term, but I see no fundamental catalyst for a durable yen rally in place.
The exit is built in. As the yen depreciates, Japanese inflation expectations rise, the BOJ normalizes, the differential compresses, and the trade ends itself.
Research suggestions
Feedback/questions/suggestions are more than welcome. Email contact@alpharhotech.com or use the subscriber chat.
