

Legal Disclaimer: Past performance does not guarantee future results, which may vary. The economic and market forecasts presented herein are for informational purposes as of the date of this presentation. There can be no assurance that the forecasts will be achieved. Copyright 2026 Alpha Rho Technologies LLC. All rights reserved.
US high-yield spreads have fallen to 2.73%, near the fourth percentile of their history. Credit is priced for historically low default rates at a moment when core inflation is still elevated and industrial momentum is modest.
Contrary to textbook logic, research shows tight spreads are not an automatic sell signal. Across comparable historical episodes, both the S&P 500 and US high-yield usually produced positive returns over the following year. Equities captured growth expectations upside implicit in credit spreads, while high-yield delivered lower returns, drawdowns and volatility.
On all periods analyzed, coupon carry managed to compensate for credit spread widening over the following 1 year period.
Methodology
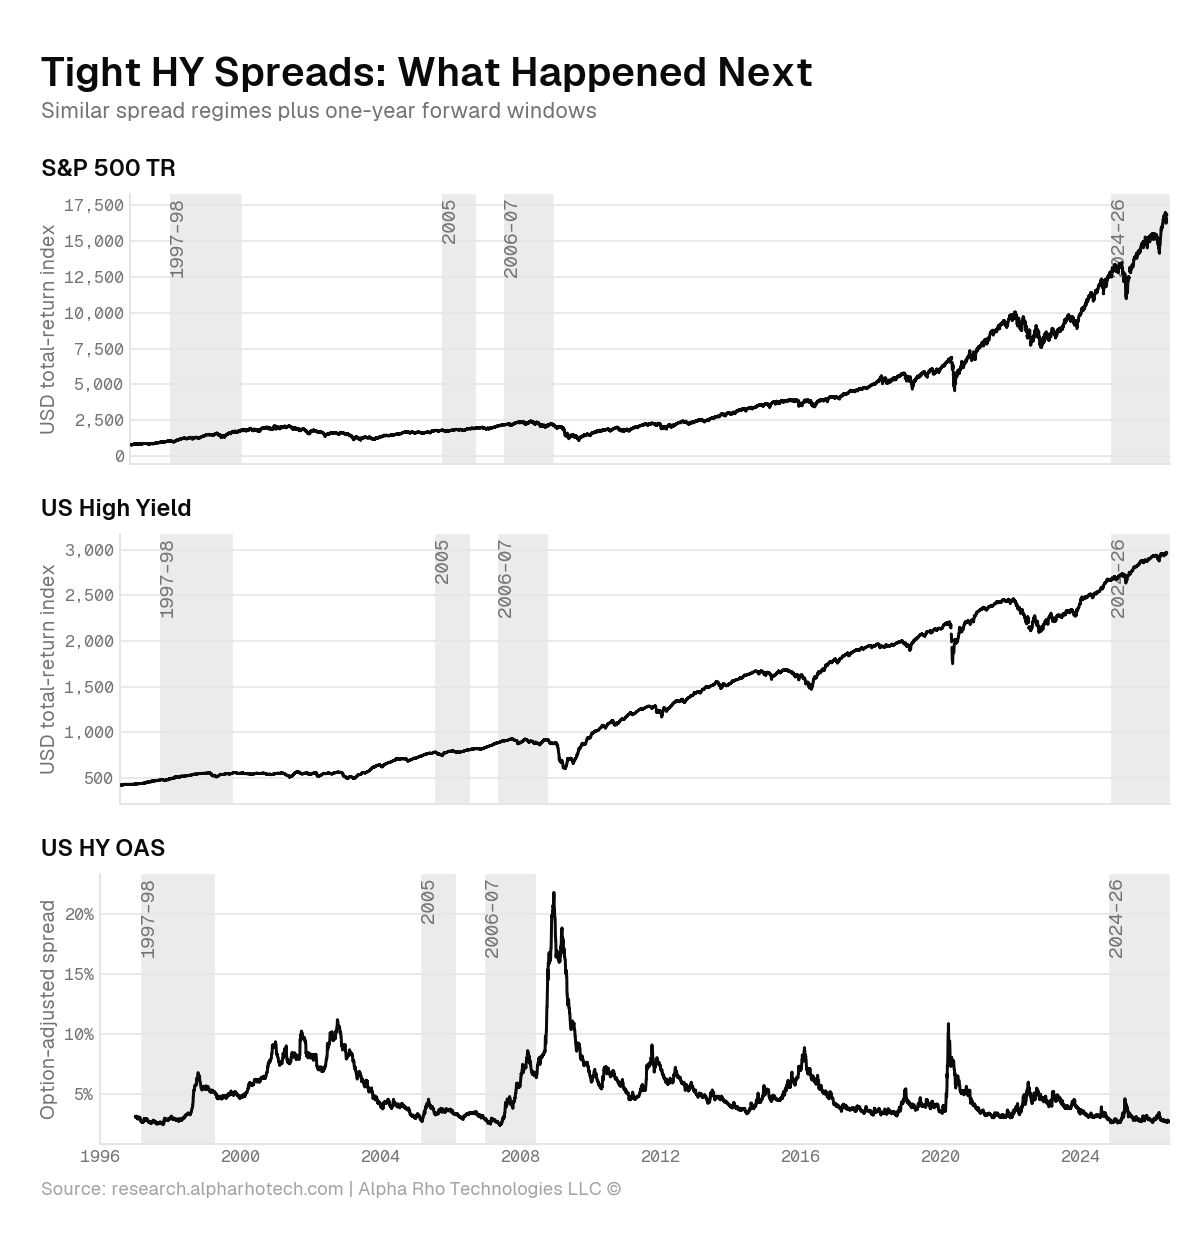
Period selection: The screen selects every observation within two percentile points of today's spread level and follows both assets for one year.
Sharpe Ratio calculation: Every outcome is measured against the current effective federal funds rate of 3.62%. An asset that fails to clear that hurdle delivered no compensation for the risk it carried.
Macro starting points
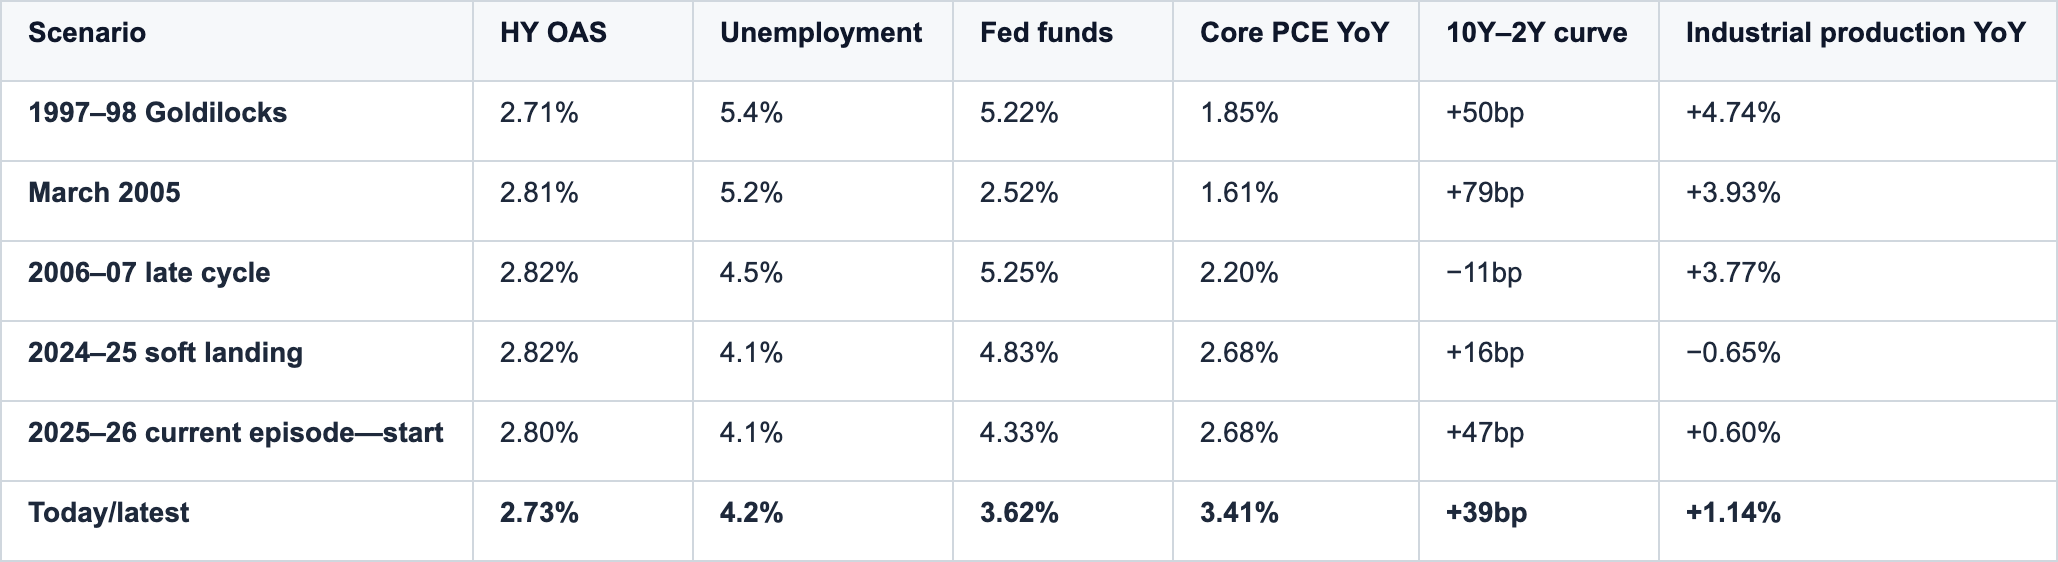
Today's backdrop is not conventionally recessionary. Unemployment is low, the curve is positively sloped at +39 bps, industrial production is expanding, and policy has already eased.
The problem is the price, not the condition: credit is offering a spread historically associated with Goldilocks conditions, while production growth is materially weaker than in 1997 or 2005 and core inflation is materially higher. That limits both fundamental momentum and the Fed's capacity to add support.
Macro Fair Value
A regression of US high-yield OAS against unemployment, the effective federal funds rate, core PCE inflation, the Treasury curve and industrial-production growth suggests that spreads are unusually tight relative to the current macro backdrop.
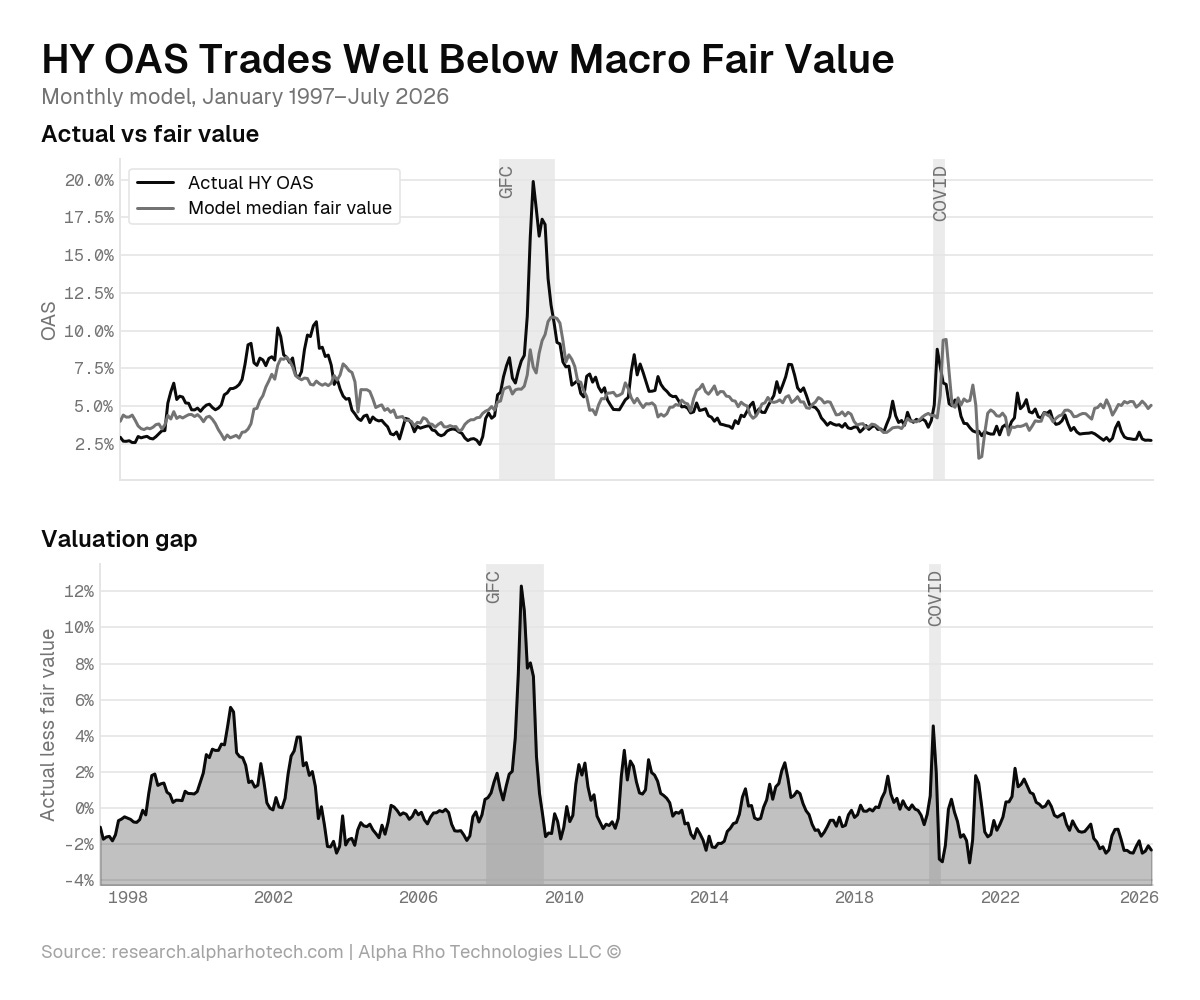
Across several model specifications, estimated fair value ranges from approximately 4.57% to 5.29%, with a median of 5.06%. Against the current 2.73% OAS, high yield trades roughly 233 basis points tighter than the macro variables alone would imply.
The regression is a valuation signal, not a timing tool. Macro variables explain only about 40% of historical spread variation, and the range of possible outcomes remains wide. It does not predict an imminent spread spike; it shows that investors are receiving substantially less compensation than the historical macro relationship would normally suggest.
Historical episodes and one-year returns
1997–98: Goldilocks supported both assets
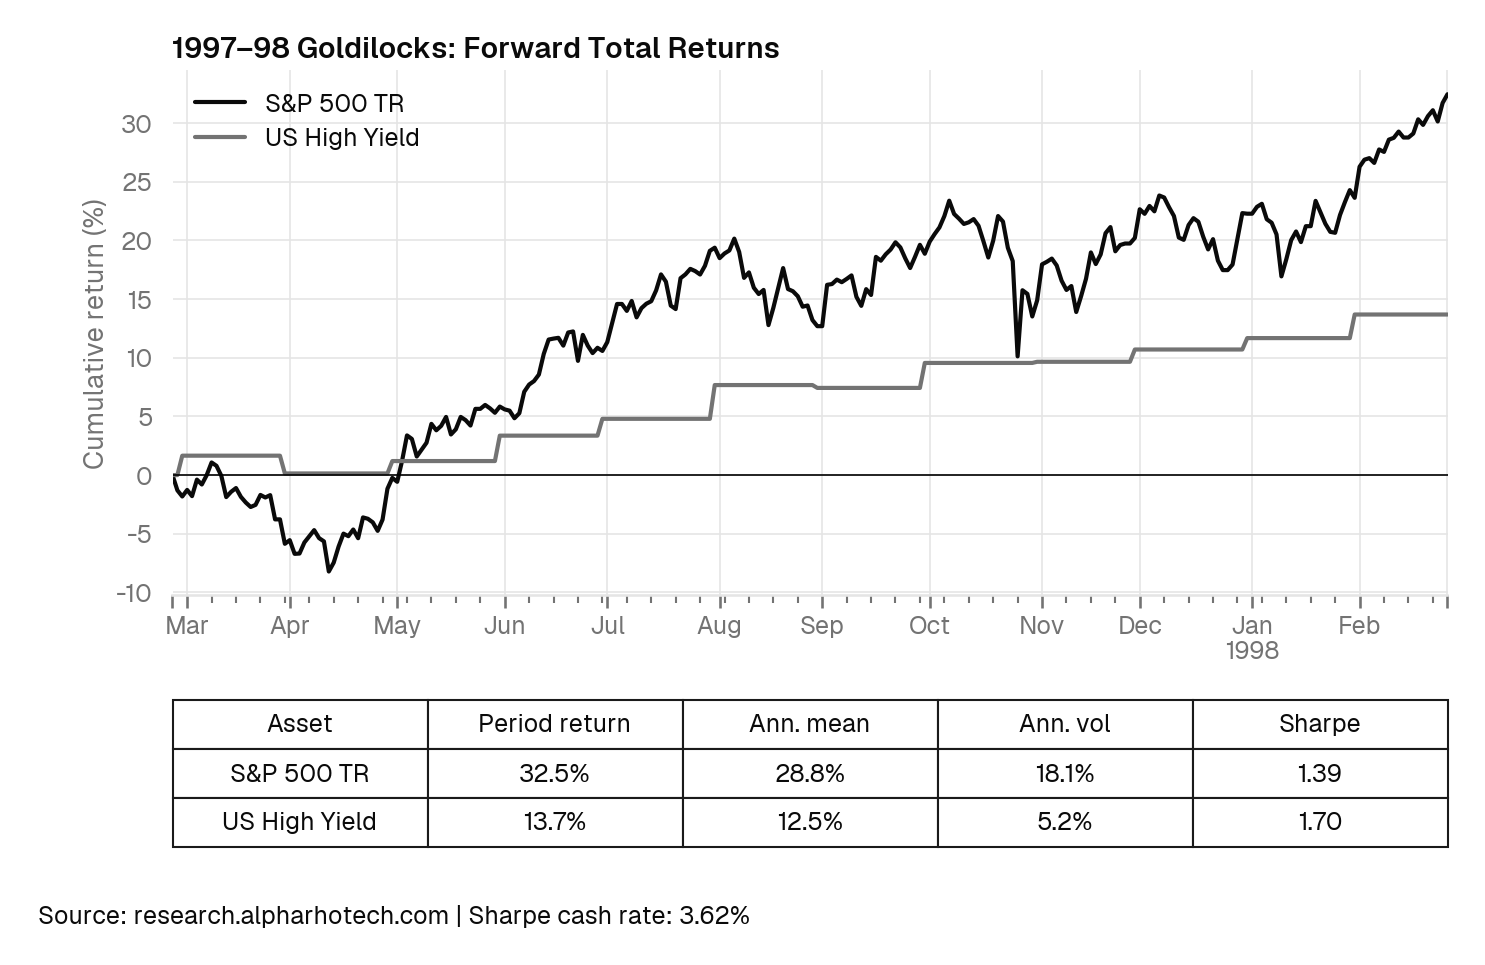
The cleanest constructive analogue. Industrial production expanded 4.7%, core PCE ran below 2%, unemployment was falling, and the curve stayed positively sloped. Equities produced more than twice the absolute return, but high-yield won on Sharpe: 13.7% on 5.2% volatility, with an unusually efficient carry after the 3.62% cash rate.
Today, core inflation is 1.56 points higher and industrial-production growth roughly 3.6 points lower. The spread resembles 1997; the growth-inflation mix does not.
March 2005: equities cleared cash, high-yield did not
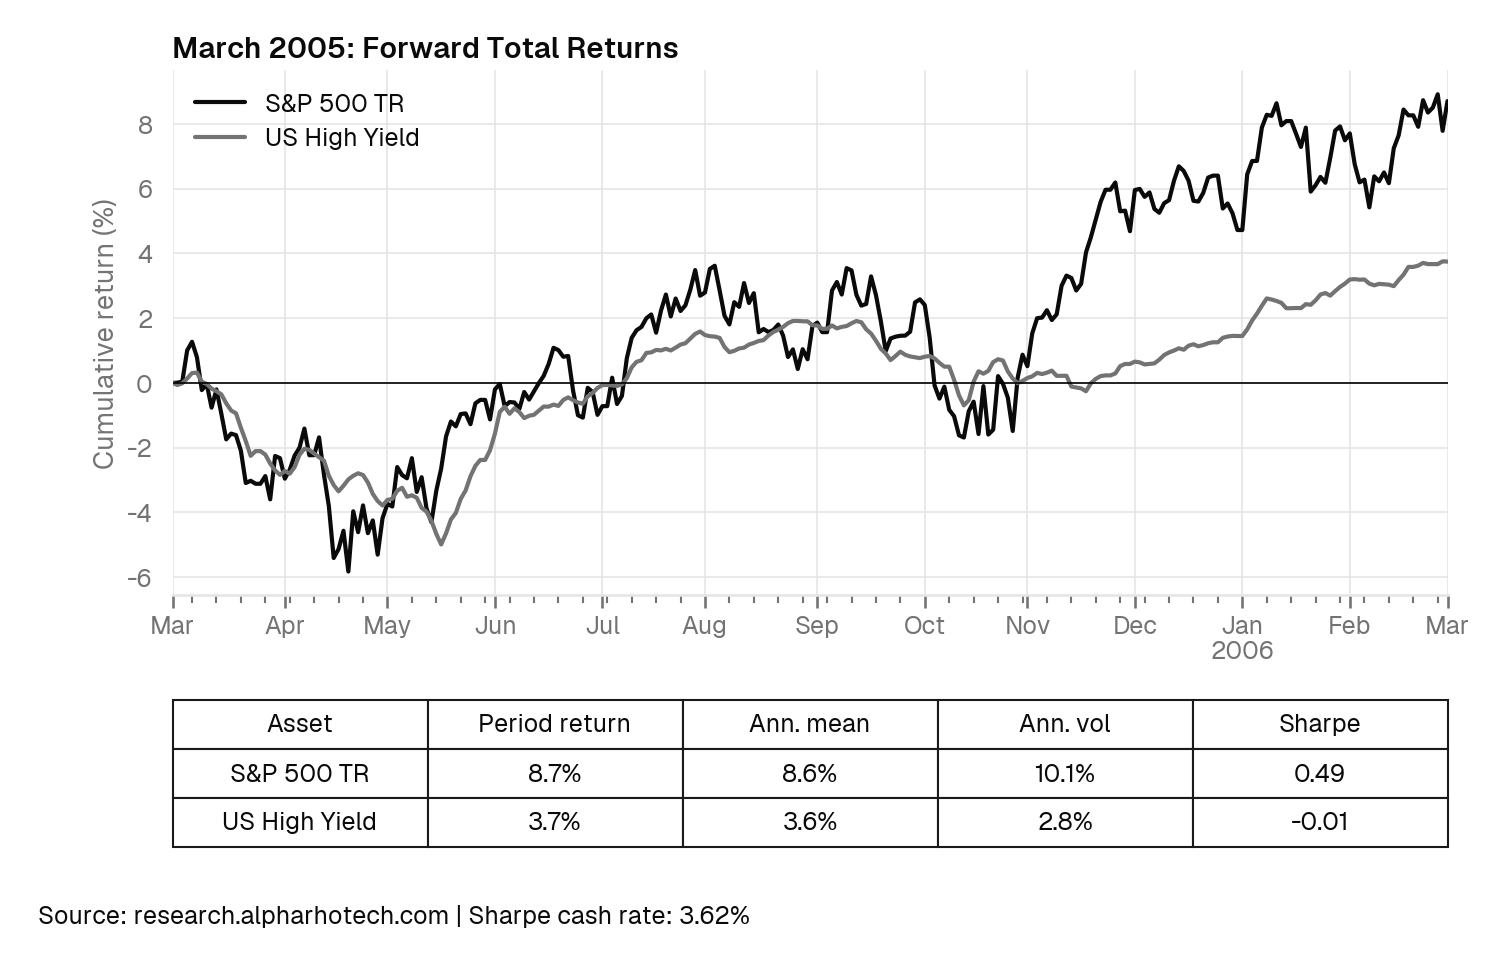
Industrial production was expanding near 4% against low core inflation and a steep +79bps curve, but the Fed was tightening and leverage was building. High-yield returned 3.7%, almost exactly today’s cash rate. After the hurdle, investors were paid nothing for credit risk, illiquidity or downside convexity, and equities produced the better risk-adjusted outcome.
Policy now runs the other way, which supports refinancing. The constraint is core inflation at 3.41%, more than double the 2005 starting rate.
2006–07: Positive returns masked deteriorating credit economics
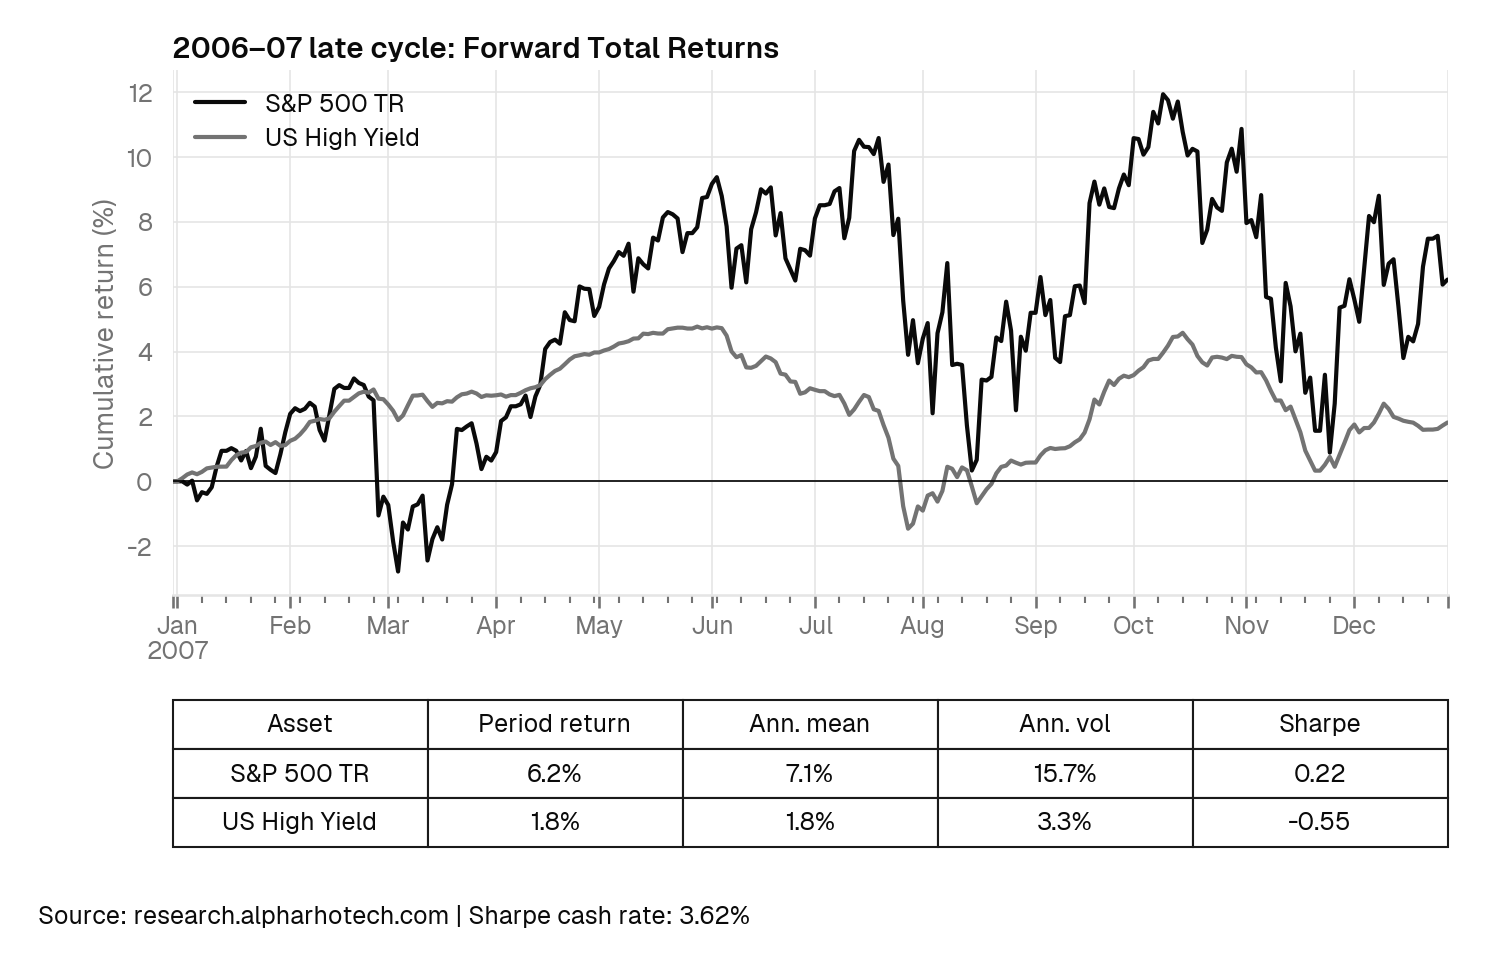
The downside case. Unemployment was 4.5%, industrial production was still expanding, and contemporaneous defaults looked contained. The warning sat in the −11bps inverted curve, which signaled that restrictive policy was already reaching housing, lending and future corporate activity. Despite the spread widening by 291 bps from 2.82% to 5.73%, high-yield returned 1.8%, positive but far below cash returns.
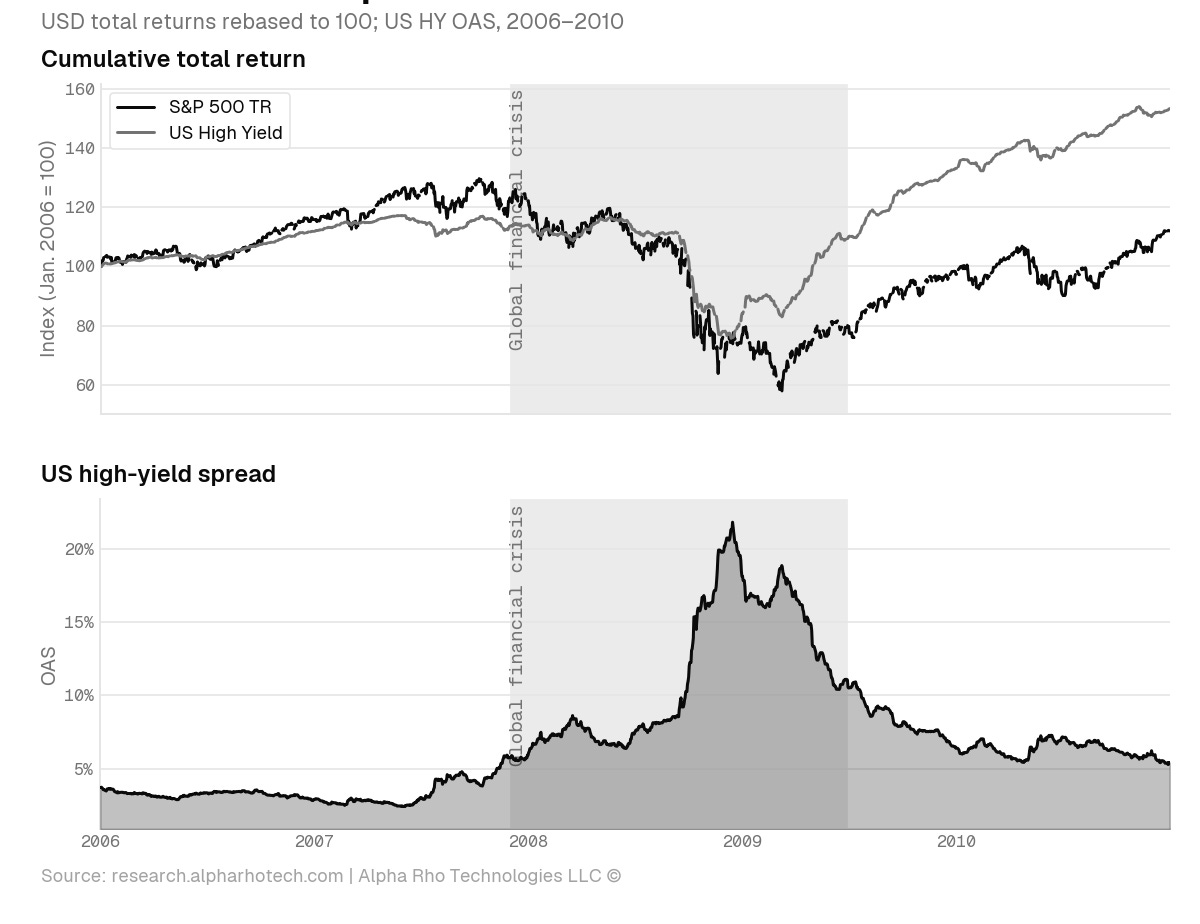
The real crash happened after months of rising spreads and warnings.
Today is less fragile on the surface: the curve is +39bps, policy has eased, and the funds rate sits 163bps below its 2006 starting point. But 1.1% production growth leaves little operating momentum if conditions tighten again. Spreads and defaults lag, and headline returns can stay positive for months while transmission deteriorates beneath them.
2024–25: Credit delivered the superior Sharpe
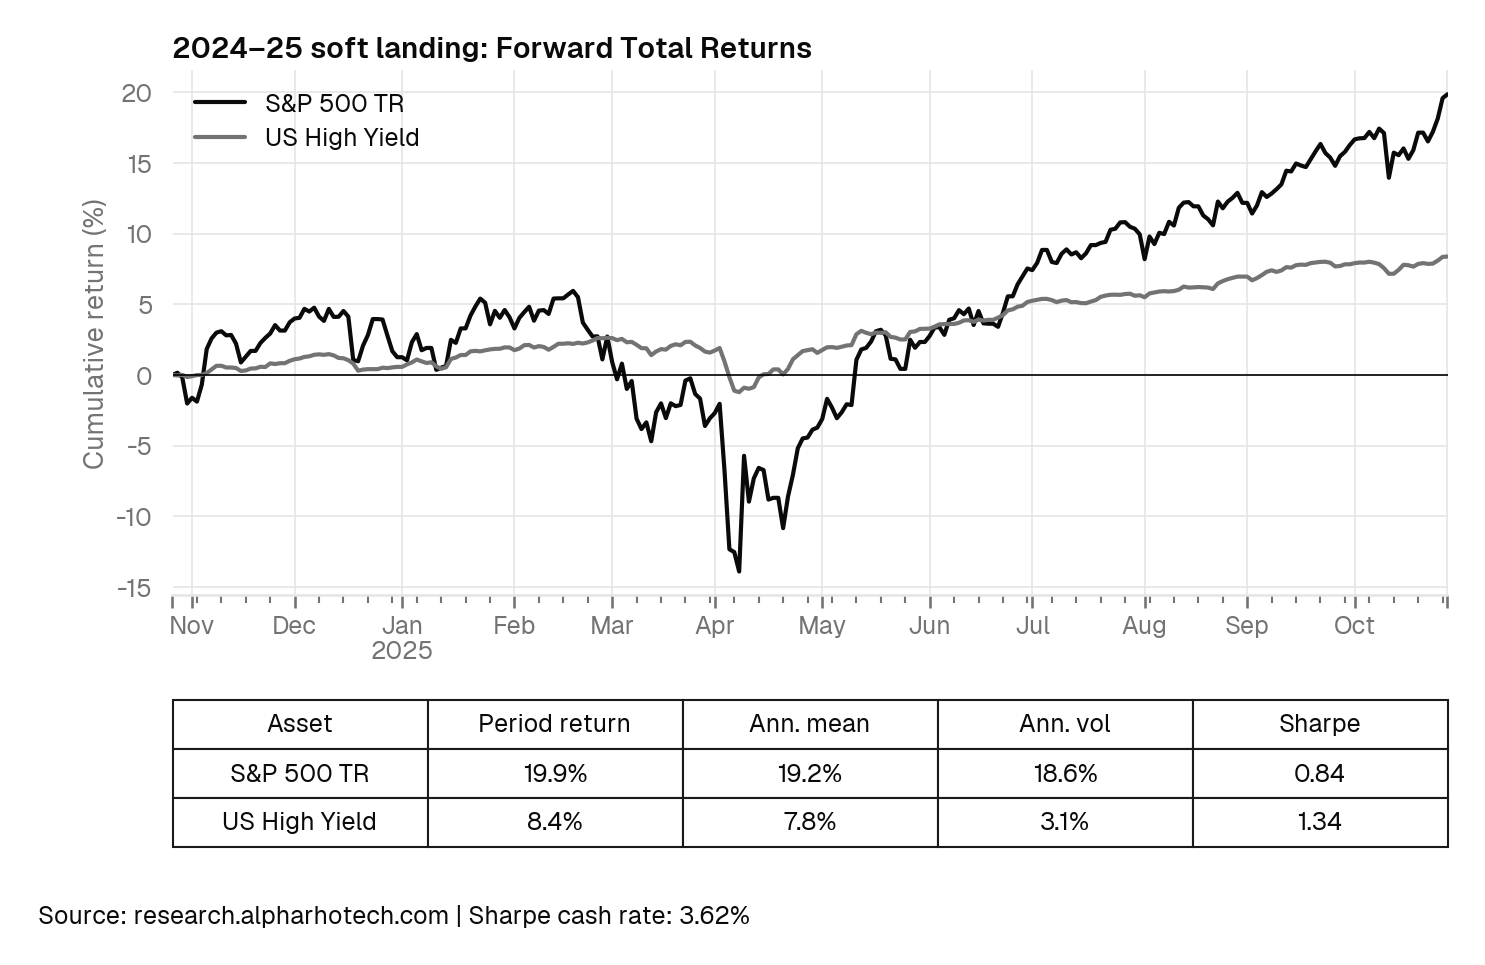
The soft-landing template. Unemployment held near 4.1%, the curve had returned to a positive slope, and policy was stepping back from peak restriction. Equities delivered the larger return, but high-yield won on Sharpe: 8.4% on 3.1% annualized volatility.
Production is better today, expanding 1.1% rather than contracting, but core PCE at 3.41% leaves a thinner policy cushion. This is the closest constructive analogue, and it is partly spent. Policy has already eased and spreads have already compressed, so further gains require resilient earnings and stable defaults rather than another monetary re-rating.
2025–26: Equity leadership, limited credit upside
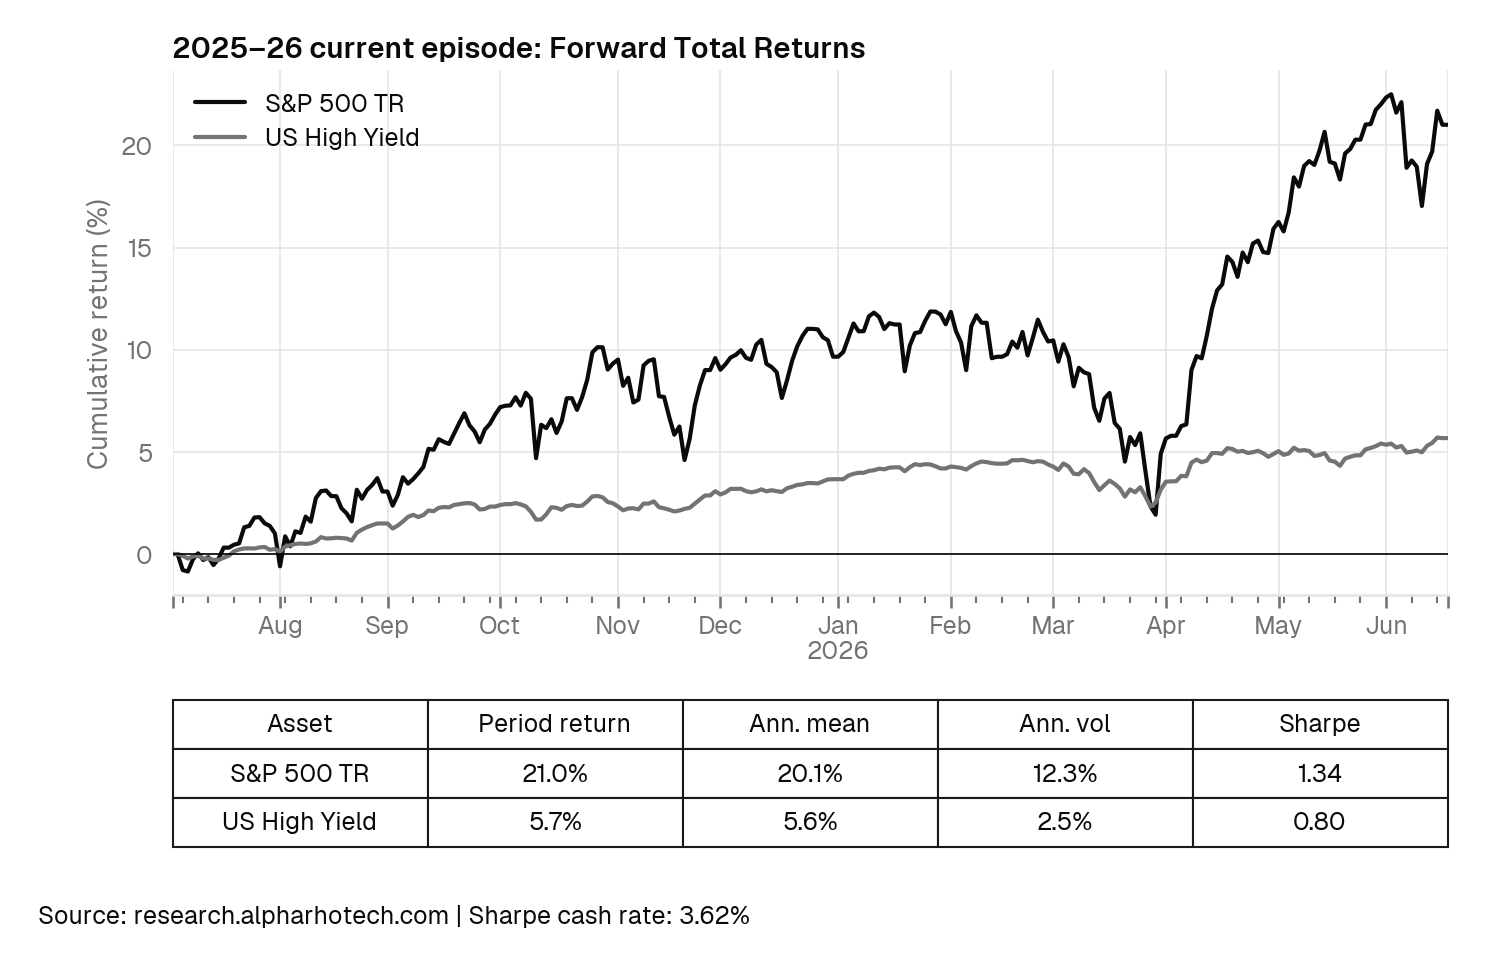
Equities have led decisively. The S&P 500 captured earnings growth and operating leverage, while high-yield leaned on coupon income. Since July 2025 the effective funds rate has fallen from 4.33% to 3.62%, production growth has improved and the curve remains positive, all of which support near-term refinancing.
Inflation is the counterweight. HY OAS has compressed from 2.80% to 2.73%, while core PCE has risen to 3.41%: the market is demanding less compensation for credit risk precisely as the Fed’s capacity to respond to weaker growth has diminished. High-yield’s 5.6% annualized mean return left roughly two points of excess return over cash.
Efficient frontier
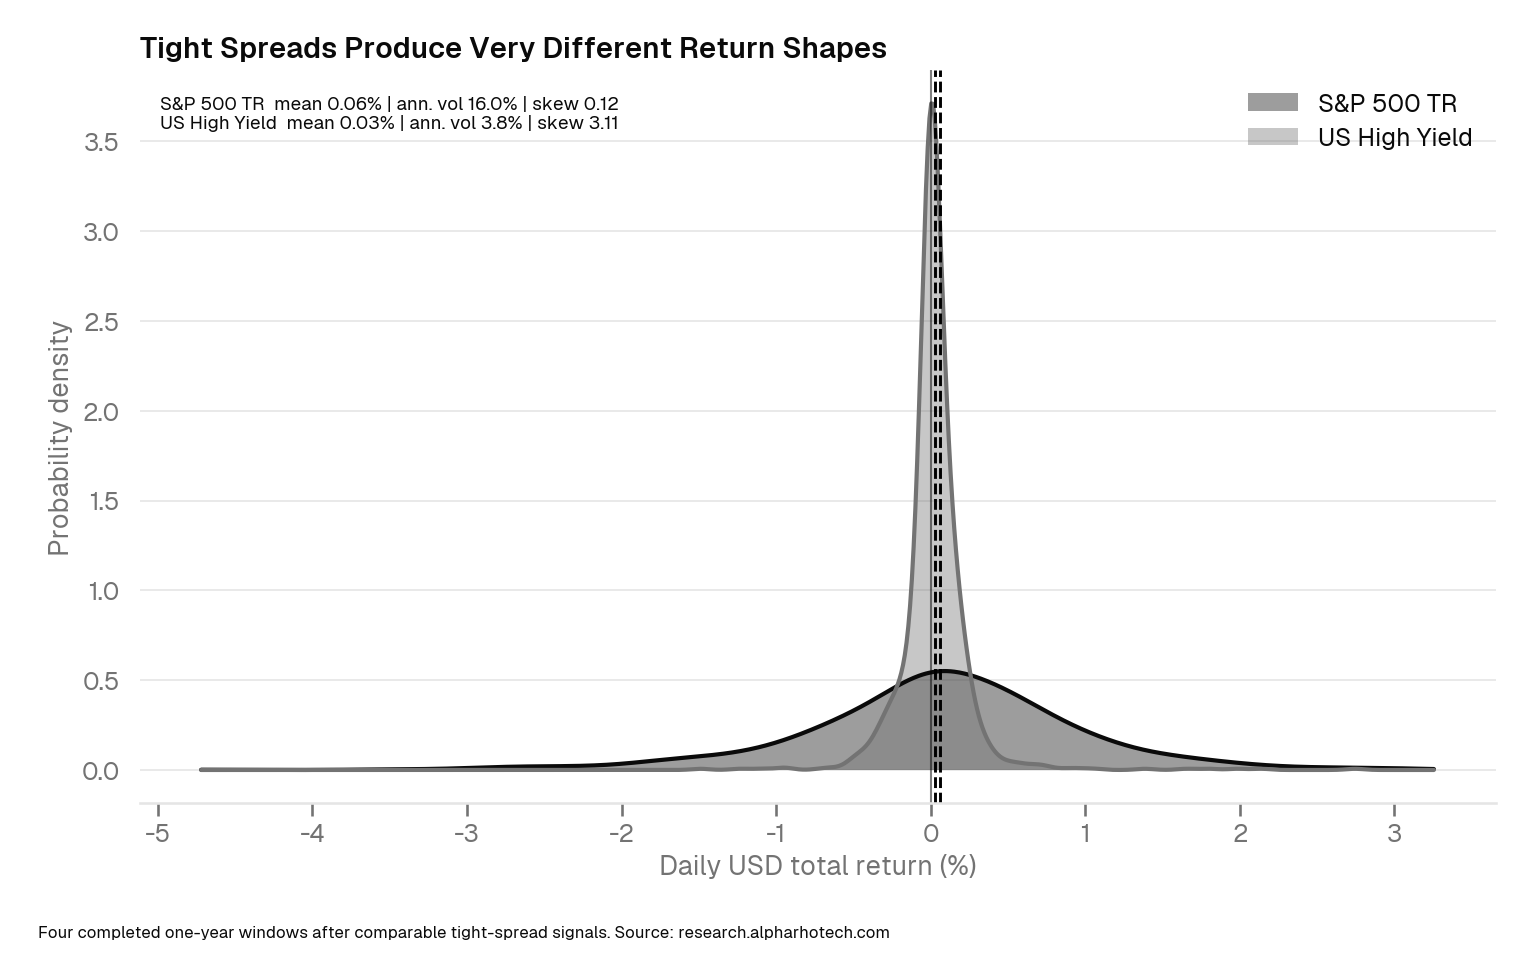
The frontier uses 1,043 aligned daily total-return observations from the periods previously analyzed. Overall, the S&P 500 generated the higher average return through a far wider distribution: 16.0% annualized volatility against 3.8% for high-yield, which clustered around small positive daily returns.
That difference in shape is the diversification opportunity. These are not competing versions of the same trade: equities monetize continued growth through earnings and operating leverage, while high-yield monetizes stable defaults and open refinancing access through carry.
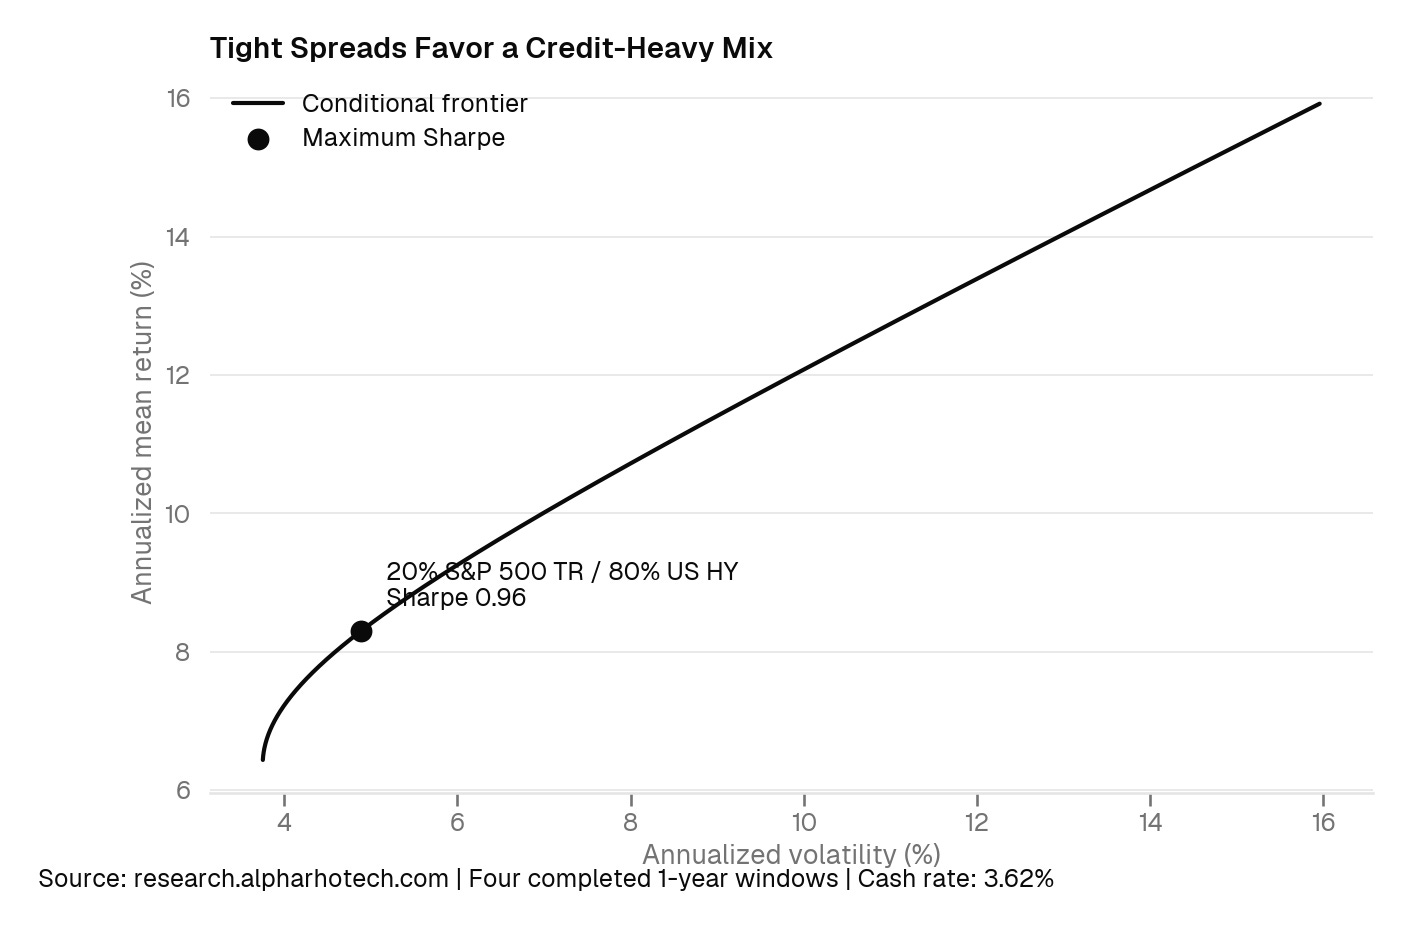
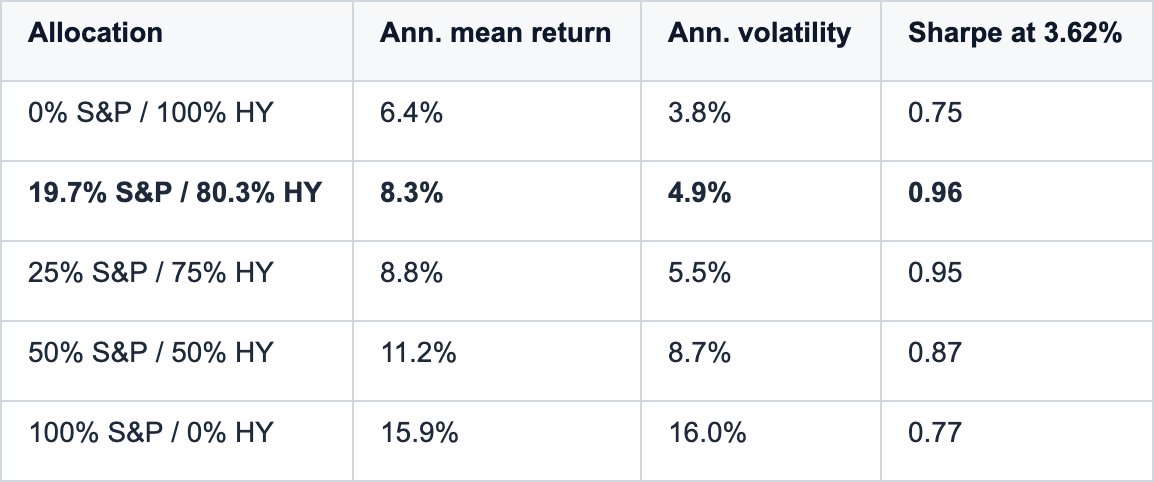
Surprisingly, under tight credit spread scenarios, the maximum Sharpe portfolio is 19.7% S&P 500 TR and 80.3% US high-yield, with a conditional annualized mean return of 8.3%, volatility of 4.9% and a Sharpe ratio of 0.96.
Conclusion
Even at these spread levels, high-yield has combined well with equities. The distributions do different things: 16.0% annualized volatility against 3.8%, with equities monetizing growth expectations and credit monetizing stable defaults.
This combination could be a great way for investors looking to diversify away from the AI growth theme equity markets are pricing while aiming for an 8% return
In my opinion, credit markets are surprisingly efficient at pricing growth shocks. When credit spreads rise, the key question to ask is, is this a temporal shock (Trump tariffs) or a long-term shock? (Eg: 2006-2009 GFC) If the latter, avoid both equities and fixed income.
Easier said than done…
Research suggestions
Questions and research requests are more than welcomed. Email contact@alpharhotech.com or use the subscriber chat.

Legal Disclaimer: Past performance does not guarantee future results, which may vary. The economic and market forecasts presented herein are for informational purposes as of the date of this presentation. There can be no assurance that the forecasts will be achieved. Copyright 2026 Alpha Rho Technologies LLC. All rights reserved.